INSIGHTS
Gold has earned a place in long-term portfolios. It is durable, scarce, and globally recognized. But gold is also volatile, cyclical, and no longer obviously cheap.
Gold’s long-run role
Gold has shown remarkable durability as a long-term store of wealth. Over a lifetime, it may appreciate substantially in nominal terms. But its path is highly unpredictable, and its price can swing far from any reasonable estimate of fair value. Gold can protect purchasing power over very long horizons while still delivering poor returns for a decade or more. It is a store of wealth, not a smooth compounder.
Why the standard gold chart can mislead
Many arguments that gold is still cheap begin in 1971, when Nixon closed the gold window. That leaves out an important period. From 1934 until 1971, the official U.S. gold price was fixed at $35 per ounce while the monetary base expanded. When convertibility ended, gold repriced after decades in which the official U.S. price had been fixed.
Gold then rose from $35 per ounce to an intraday high near $850 in January 1980, an increase of roughly 2,300%. The 1970s surge was not a simple template for what happens every time money supply grows. It was, in important part, a repricing after a long period in which the official price had not adjusted.
A broader valuation framework
Rather than looking only at the gold price, I compare estimated gold market capitalization with global M2 and world GDP. The framework assumes 1.35% annual gold-supply growth, which better reflects the economics of the full above-ground gold stock. This moves the question from “Is gold expensive in dollars?” to “How large is gold relative to the monetary system and the global economy?”
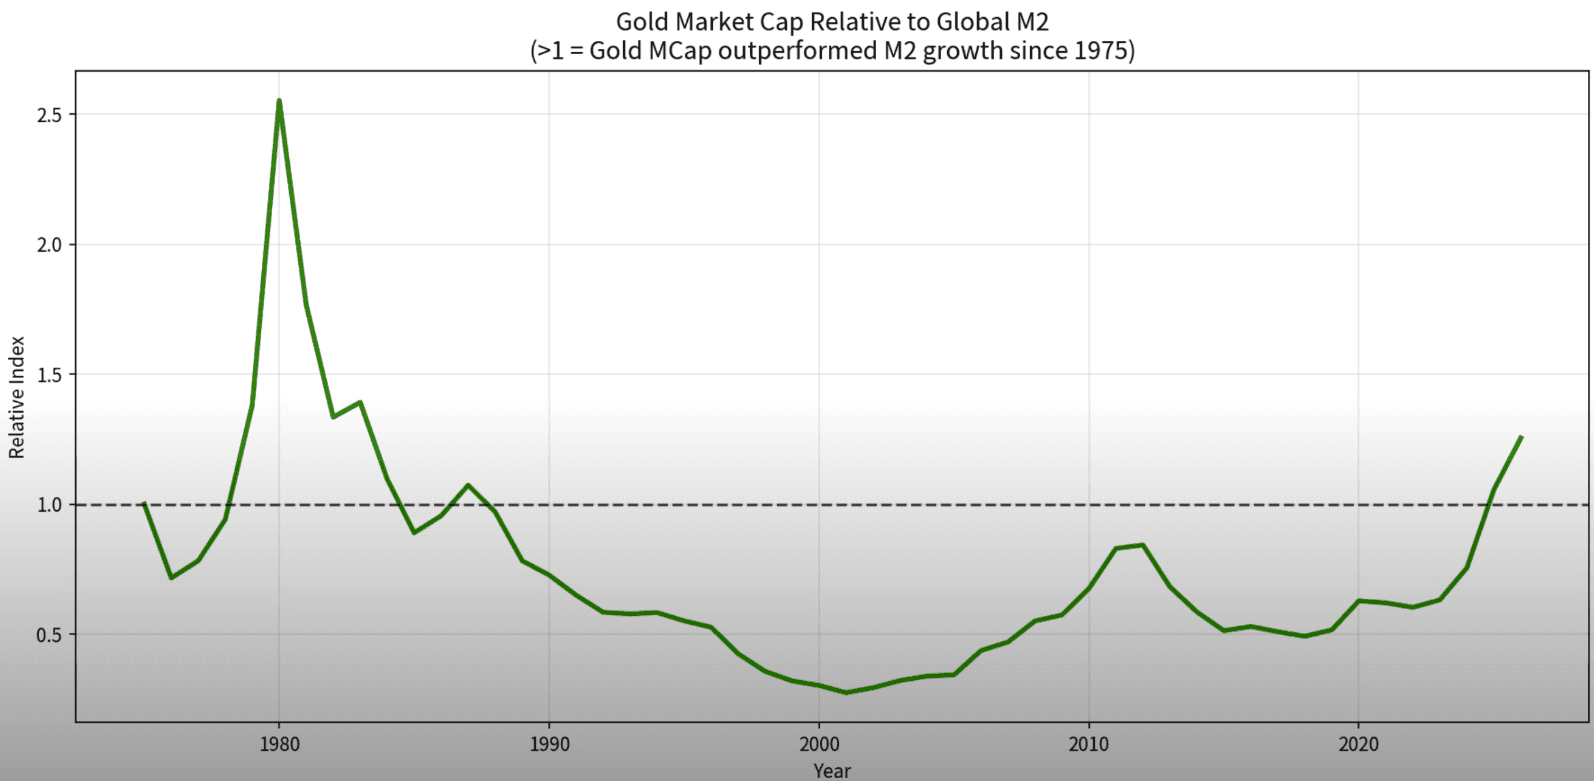
Gold market cap versus global M2
Indexed to 1975, gold market capitalization has increased relative to global M2 by roughly 25%. Gold has more than kept pace with broad global monetary expansion over the last half century. That is exactly the kind of durability long-term holders want from a monetary asset. It also means gold is not obviously cheap relative to money creation today.
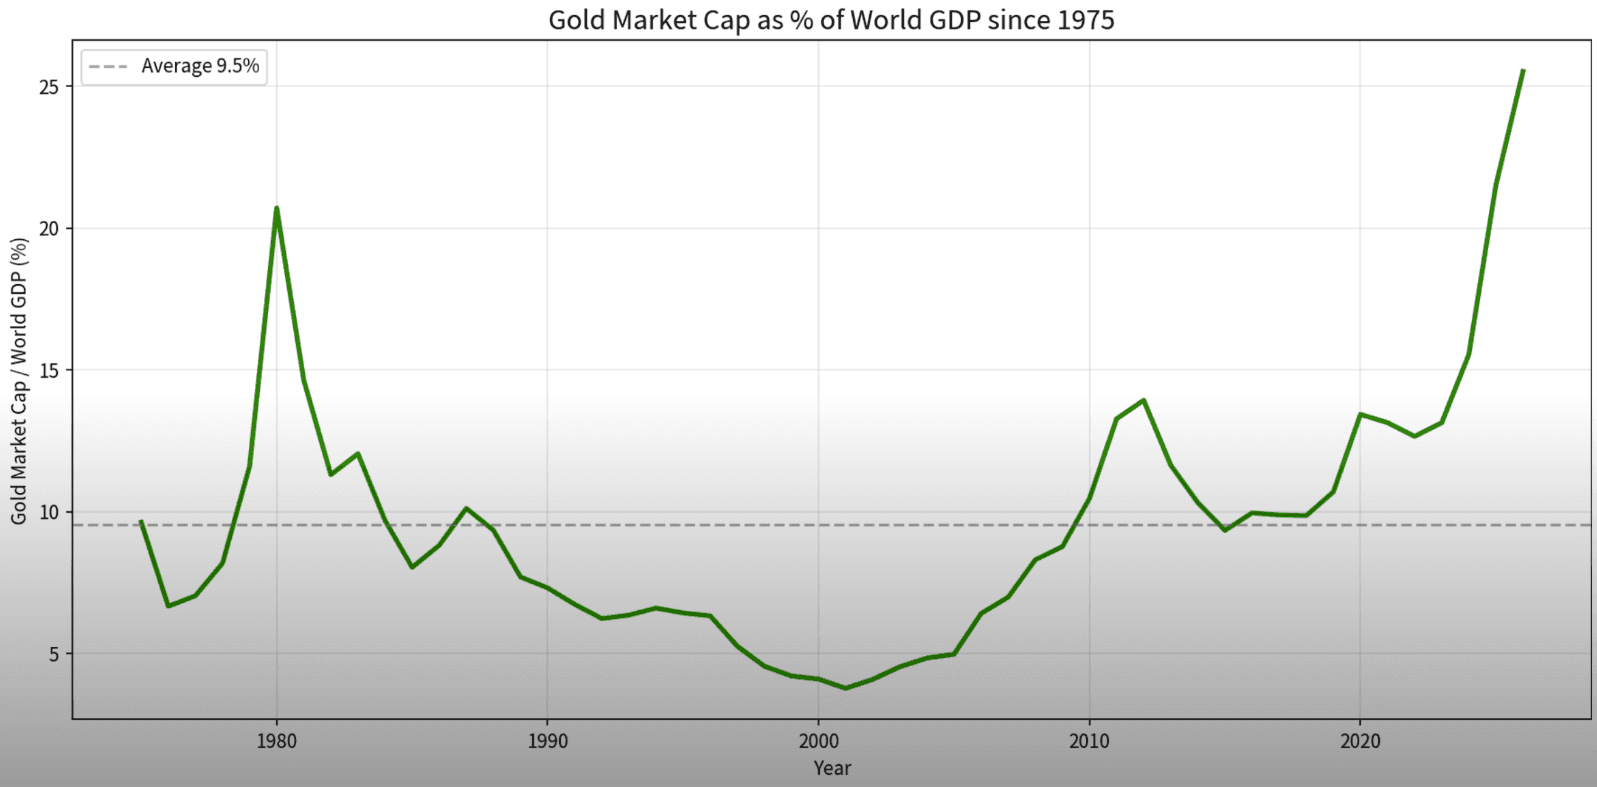
Gold market cap versus world GDP
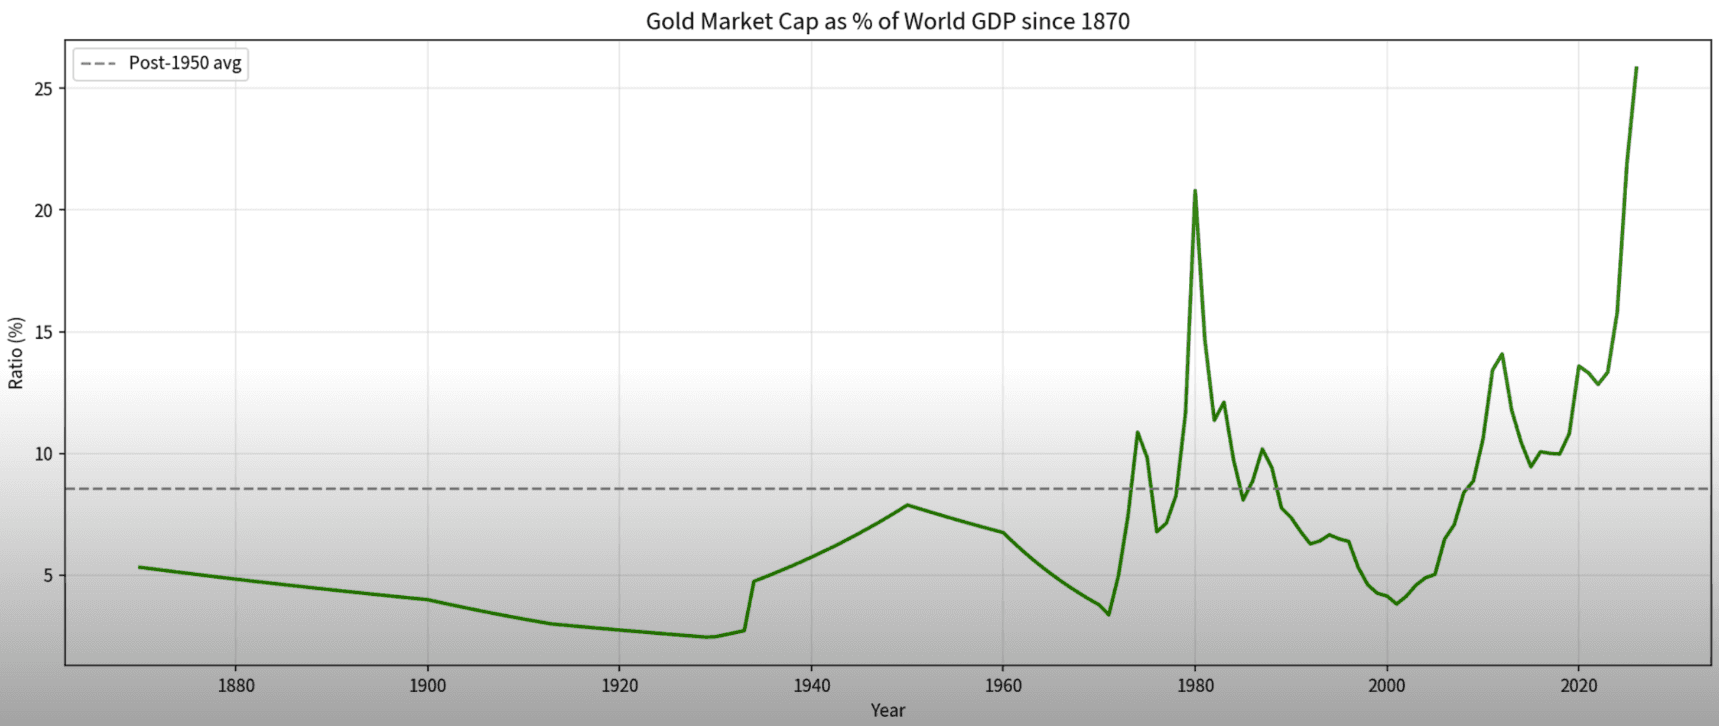
Gold market capitalization rose from approximately 9.5% of world GDP in 1975 to approximately 25.5% at the latest observation, an increase of roughly 170%. Extending the analysis back to 1870 suggests an increase of roughly 400%, although earlier comparisons are less clean because global money data are limited and the official gold price was fixed for long periods. The long-run result is impressive. It is also evidence that gold has already done a great deal of work.
Durable does not mean smooth
Gold does not produce cash flow, reinvest earnings, or benefit from productivity gains the way businesses do. Its returns come from revaluation, monetary repricing, and changes in investor preference. It can be a strong hedge against monetary disorder and a credible store of wealth, but it can also go nowhere for years, underperform inflation for extended stretches, or surge violently in brief bursts.
What may be driving the recent surge
Central banks have been net buyers since 2010, with purchases rising sharply in 2022 and remaining elevated thereafter. That is an important backdrop, but it does not fully explain the speed of the advance that began in early 2024. Nor does an imminent dollar-collapse narrative fully fit the evidence: there is not a clear collapse in Treasuries, the dollar index, or market-implied inflation expectations. Gold has, at least temporarily, separated from several traditional drivers, including real yields.
A great long-term asset is not always a great entry point
Gold remains a serious asset. It has protected wealth over very long periods and may continue to do so. But durability does not mean attractiveness at every price. Relative to global M2 and world GDP, the picture is not one of obvious cheapness. I liked gold much better near $2,000 in late 2023, when it looked inexpensive relative to money supply. As of August 2026, the prospective risk-reward profile appears less favorable. That is not a call for gold to collapse. It is a reminder not to confuse a great long-term asset with a great entry point.
Sources and context
Framework and estimates prepared from gold supply assumptions, global M2 data, world GDP data, and historical gold-price series. Gold market capitalization is estimated from above-ground gold-stock assumptions and gold prices; the framework assumes 1.35% annual gold-supply growth. The global M2 comparison should be read as a constructed aggregate and is subject to differences in national coverage, data definitions, currency conversion, observation dates, and revisions. Figures are intended for educational discussion, are subject to methodology choices and data revisions, and are not individualized investment advice. Historical results do not guarantee future outcomes.
One research note a month.
Clear, data-driven analysis on investing, risk, and building long-term wealth. No spam. Unsubscribe anytime.